Instagram reached 3 billion monthly active users in September 2025, and Mark Zuckerberg said it passed 2 billion daily users in Q2 2026. For creators, brands, and marketers, the platform sits at a specific inflection point: it is still the primary discovery destination for visual content in most markets, but the composition of what performs on it has shifted decisively toward video, mobile-first formats, and AI-assisted creative.
These are the ten statistics that shape any credible Instagram strategy in 2026, followed by what each number actually means for the way you plan content, budget spending, and set growth expectations. And because a number is only useful if you can act on it, the second half of this guide covers how to grow above the averages these statistics describe.
The 10 Instagram Statistics You Need to Know for 2026
1. Instagram Has 3 Billion Monthly Active Users
Instagram joined Facebook and WhatsApp in the 3 billion club when Zuckerberg announced the milestone in September 2025. It had last disclosed passing 2 billion in 2022. In the US alone, half of adults say they use Instagram (Pew Research Center, 2025). In practical terms: the reach ceiling on Instagram is effectively unlimited for most creators. The bottleneck is discoverability, not audience availability.
2. Reels Account for About Half of Time Spent on the Platform
Instagram head Adam Mosseri has said users now spend roughly half their time on the app watching video, and that most of those videos come from accounts they do not follow. Sensor Tower estimates put Reels at 51% of US time spent on Instagram in Q2 2026. For creators, this means posting formats that ignore Reels leave a large share of potential reach on the table.
3. The Average Instagram Engagement Rate Is About 0.48% Across All Formats


Engagement rate (likes plus comments divided by followers) averaged 0.48% in 2025, down 24% year on year, according to Socialinsider’s analysis of 35 million posts. Rates vary significantly by account size. HypeAuditor data reported by EMARKETER puts nano-influencers (1,000 to 10,000 followers) at 1.78%, micro-influencers (10,000 to 50,000) at 0.54%, and accounts with over 1 million followers at 0.33%. The takeaway: smaller accounts with tight-knit audiences almost always outperform mega-accounts on engagement metrics, which favours niche content strategies.
4. Carousels and Reels Lead on Engagement per Post
Carousels edge out Reels on engagement rate, at 0.55% versus 0.52% in 2025, with single images well behind at 0.37%. The two formats win on different signals: Reels earn the most comments across every account size, while carousels collect the most saves. Stories drive different metrics again: they generate views and DMs rather than likes, but they build daily audience habits that convert into long-term retention.
5. 62.8% of Instagram Users Use It to Follow or Research Brands
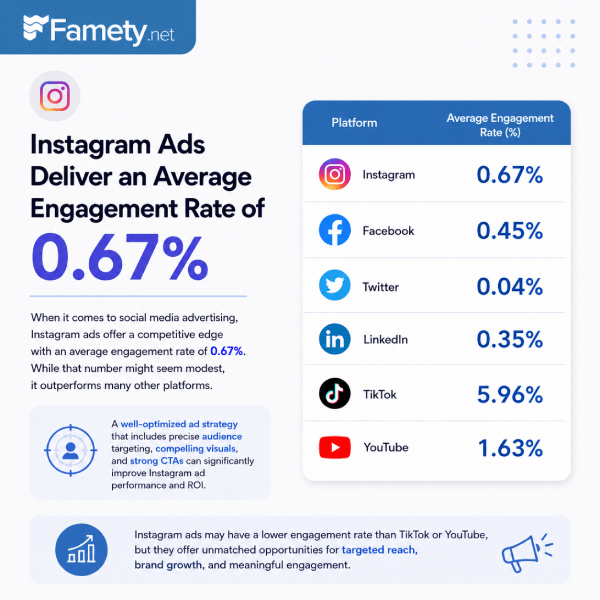
Instagram is not just a personal platform. In GWI survey data cited by DataReportal, 62.8% of active Instagram users say they use it to follow or research brands and products, the highest share of any social platform. Instagram also says over 2 million businesses connect with people on Instagram. For any business (small businesses, DTC brands, creators-as-brands), Instagram remains one of the strongest social channels for product discovery.
6. About Two in Three Instagram Users Open the App Daily
Similarweb data shows 65.4% of Instagram’s Android users open the app every day. Meta’s own figures point the same way: 2 billion daily users in Q2 2026 against 3 billion monthly users. Daily active use is the metric that matters most for creators: it determines how often your content has a chance to be seen. Daily users see more Reels, more Stories, and more feed posts than weekly users, which multiplies the value of consistent posting.
7. The Average Instagram User Spends About an Hour per Day on the App
Sensor Tower estimates US users spent 59 minutes per day on Instagram in Q2 2026, up 12% year on year. Similarweb puts the global Android average at 1 hour 13 minutes per day (August 2025). This is a substantial attention window, but it is also fragmented: the same Similarweb data shows users open the app around 12 times a day, with a typical session lasting just under 6 minutes.
8. Instagram Ads Reach Over 1.7 Billion Users
Meta’s planning tools showed Instagram ads could reach 1.74 billion users in January 2025, up 5.5% year on year. By April 2026, India alone accounted for more than 513 million users of Instagram’s reported ad reach, over a quarter of the global total. Ad costs vary widely by market, placement, and targeting. For businesses, Instagram remains one of the most cost-efficient paid channels for visual and video creative, particularly when paired with well-crafted Reels ads. Sensor Tower estimates Reels now carry more than half of Instagram’s US ad placements.
9. Over 130 Million Accounts Tap Instagram Shopping Tags Every Month
When Instagram last published the figure, more than 130 million accounts were tapping to reveal product tags on shopping posts every month (September 2019). Social commerce has continued to evolve since then: Instagram removed the Shop tab from its main navigation in February 2023, while keeping shopping available across feed, Reels, Stories, Explore, and ads. Product tags remain widely used and effective for discovery.
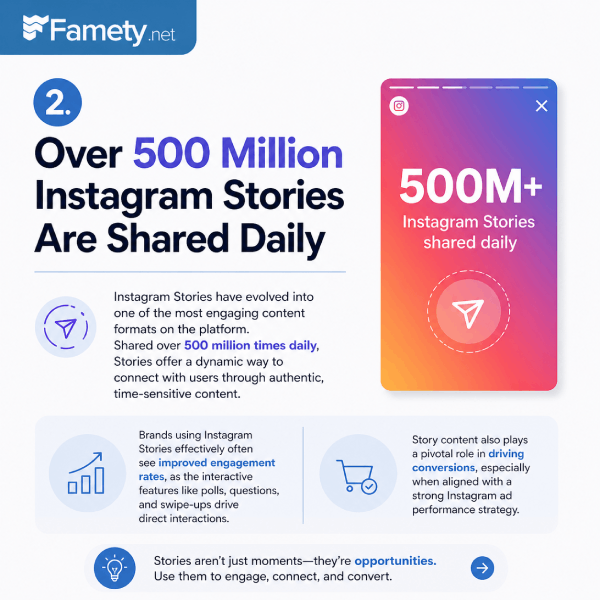
10. Over 500 Million Accounts Use Instagram Stories Every Day
Instagram Stories passed 500 million daily active users, Zuckerberg said in January 2019, and Meta has not published an updated Stories figure since. Despite the rise of Reels, Stories remain a distinct product with distinct behaviour: users use Stories to keep up with people and accounts they already follow, not to discover new ones. This makes Stories the retention format, complementary to Reels’ discovery role.
What These Numbers Mean for Your Strategy
| Statistic | What It Says | What to Do |
|---|---|---|
| 3B monthly users | Ceiling is not the issue | Focus on discoverability, not reach potential |
| Reels about half of time spent | Video is the growth format | Post 3 to 5 Reels per week minimum |
| 0.48% avg engagement | Averages hide huge variance | Aim for 1%+ if under 100K followers |
| Carousels and Reels lead | Format choice matters | Reels for discovery, carousels for depth, Stories for retention |
| 62.8% follow or research brands | Users welcome brand content | Brand accounts can grow without feeling out of place |
| About 2 in 3 open it daily | Daily posting compounds | Consistency beats intensity |
| About 1 hour/day, ~6 min sessions | Attention is fragmented | First 2 seconds of every Reel decides retention |
| 500M daily Story users | Stories = retention tool | Use Stories to keep existing followers engaged |
How to Grow Above These Benchmarks
Post the Format the Platform Wants
Instagram’s algorithm rewards Reels because Reels compete with TikTok for user time. Accounts that focus on Reels get disproportionate distribution compared to accounts still relying on photo posts. This does not mean abandoning other formats: it means Reels should be the anchor of your content mix, with carousels and Stories playing complementary roles.
Optimise for the First Two Seconds
With about an hour of daily attention split across a dozen sessions of around six minutes each, viewers make snap decisions about whether to keep watching. Strong opening hooks, dynamic visuals in the first frame, and clear stakes decide whether a Reel makes it past the two-second mark. Accounts that master hook design outperform accounts with better-produced content but weaker openings.
Convert Daily Users into Story Habits
Daily Story viewers represent the most loyal segment of your potential audience. Getting followers into the habit of checking your Stories daily creates a retention layer that Reels alone cannot build. Daily Stories about your process, your work, your community, and behind-the-scenes moments turn casual followers into engaged fans.
Use Product Tags and Shopping Features If Relevant
If you sell anything (physical products, digital products, services, courses), product tags and Instagram Shopping features are underused by many creators. The accounts that tap product tags every month represent buying intent, and product tags let you turn discovery moments into transactional ones without disrupting the content experience.
Follow Engagement Rate Benchmarks by Size
The 0.48% platform average is misleading if you are a smaller account. Aim for engagement rates that match your size tier, based on HypeAuditor’s 2026 tier averages:
- Under 10K followers: the average is 1.78%, so target 2% or higher.
- 10K to 50K followers: the average is 0.54%, so 0.6% to 1% puts you ahead.
- 50K to 1M followers: aim to stay above the 0.48% platform average.
- Over 1M followers: the average is 0.33%, so 0.35% to 0.5% is competitive.
Post Consistently, Not Just Frequently
Consistency matters more than raw volume. An account that posts three times per week every week for six months typically outperforms an account that posts twice per day for two weeks and then falls silent. Instagram’s algorithm learns audience patterns from your consistency and distributes new content based on that learned pattern.
Grow Your Instagram Faster with Famety
The statistics above describe averages, and averages are what you beat when you actually grow. Accounts that outperform benchmark engagement rates and reach get there through content quality, consistency, and a starting audience strong enough that early engagement signals are meaningful.
Famety helps creators grow their Instagram followers and accumulate Instagram likes to build the early engagement base that gets your content past the algorithm’s cold-start problem. A stronger starting audience means every Reel, carousel, and Story lands in front of more people from the moment it goes live, giving Instagram’s recommendation system more data and more positive signals to work with.
Frequently Asked Questions About Instagram Statistics 2026
How many users does Instagram have in 2026?
Instagram has 3 billion monthly active users, a milestone announced in September 2025, and passed 2 billion daily users in Q2 2026. This total includes both personal and business accounts across every major market.
What is the average Instagram engagement rate?
The platform average was 0.48% in 2025, but this hides significant variance by account size. Nano-influencers with 1,000 to 10,000 followers average 1.78%, while accounts over 1 million followers average 0.33%.
What format performs best on Instagram in 2026?
Reels account for about half of time spent on Instagram. On engagement rate, carousels (0.55%) narrowly beat Reels (0.52%), with single images at 0.37%. Stories serve a different purpose: retention rather than discovery.
How much time do people spend on Instagram daily?
US users averaged 59 minutes per day in Q2 2026 according to Sensor Tower, and Similarweb puts global Android users at 1 hour 13 minutes per day, split across about 12 short sessions. About half of that time is spent watching Reels.
How many people follow a business on Instagram?
62.8% of active Instagram users say they use the platform to follow or research brands and products, the highest share of any social platform in GWI’s data. That makes Instagram a top-tier social discovery channel for businesses and creators.
How many people use Instagram Stories daily?
The most recent official figure is over 500 million daily users, shared by Meta in January 2019. Stories are used primarily to keep up with accounts users already follow, making them a retention format rather than a discovery format.